Changes to reporting measures
What has changed?
- Changes to claim report dates and measures
- Changes to industry averages
We've changed how and when claims are captured in your claims and safety dashboards in WorkCover Connect. The updates, based on customer feedback, will give you consistency across reporting within WorkCover Connect, as well as better alignment to organisational reporting metrics.
The old dashboards with remain available in WorkCover Connect until 1 July 2020.
Changes to claim report dates and measures
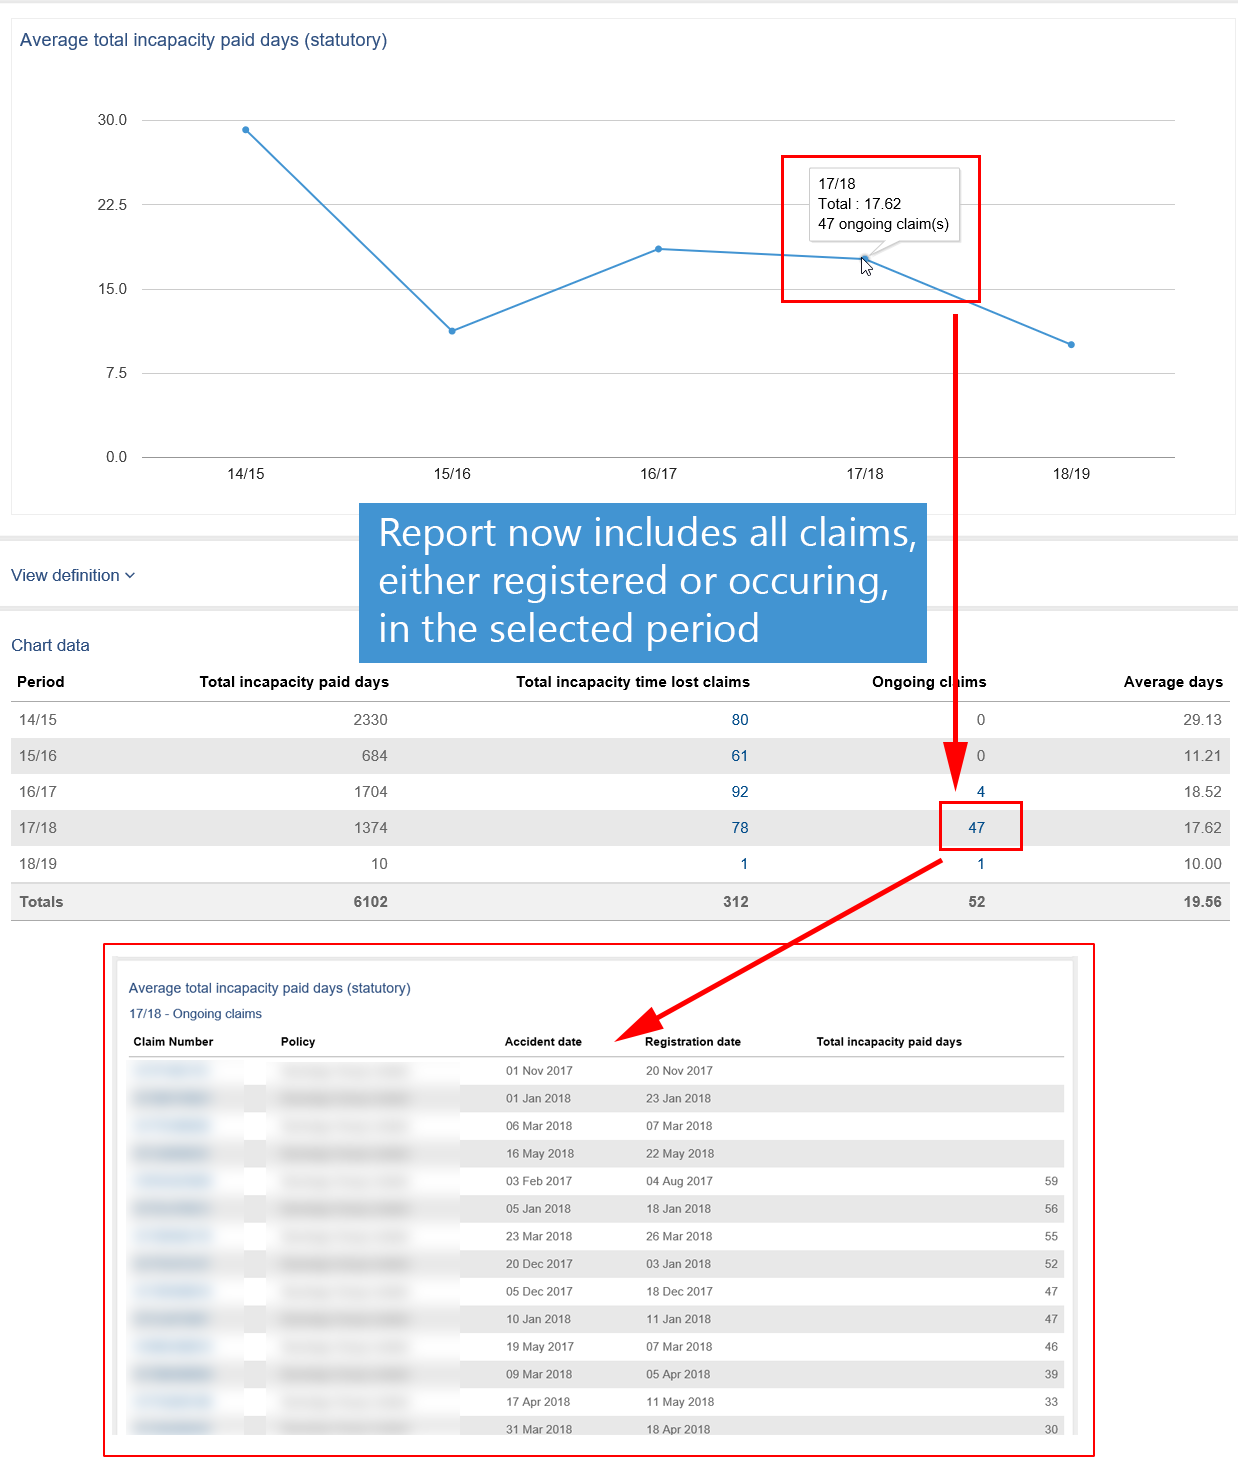
Previously on the dashboards, claims were reported based on when an event or activity occurs (for example when compensation payments are made). From late October 2018, claims are reported based on either a registration or accident date in the period selected.
This means costs associated to the claim will be reflected in the year of the measure you are looking at, preventing the challenges associated with ongoing claims across multiple financial years. The options are flexible so your end of financial year reporting on claim costs can be managed in the way that best suits your business.
- Final RTW%
- Average TI paid days
- Average PI paid days
- Average days to first RTW
- Average claim costs (statutory and common law).
Examples of the reporting measures
Average total incapacity (TI) example
Average paid days : A claim registered in May 2016, with: 10 total incapacity (TI) days paid between 1 July 2015 and 30 June 2016 and 3 TI paid days after 1 July 2016 | |
Old reports 10 paid days would be reported in 2015/16 year and 3 would be reported in 16/17 | New reports All 13 paid days will be reported in the 2015/16 year - the period when the claim was registered. |

Final RTW example
Final RTW: A claim registered in May 2016 that closed 15 July 2017 | |
Old reports: The RTW outcome would be reported in 2017/18 financial year | New reports: The RTW outcome would be reported in 2015/16 financial year (based on the registered date of the claim) |
Changes to industry averages
There is no industry average available for 'accepted claims' and 'common law claims'. We cannot provide an accurate comparison, as employee numbers across the industry vary greatly.
| Industry average available | Industry average NOT available |
|---|---|
| Stay at work % (statutory) | Accepted claims |
| Final return to work % (statutory) | Common law claims |
| Average total incapacity paid days (statutory) | |
| Average partial incapacity paid days (statutory) | |
| Average days to first return to work (statutory) | |
| Average claim cost (statutory) | |
| Average claim costs (common law) |
When will I see these changes?
The dashboards were updated on Monday 22 October 2018. For more information about WorkCover Connect, visit the guide.
The old dashboards will be removed on 1 July 2020.
Do you need help with the changes to report measures?
If you'd like more information about the changes, get in touch with your relationship manager or contact us.
